Australian (ASX) Stock Market Forum

DrBourse TA Help for Beginners

Joined
28 August 2022
Posts
3,520
Reactions
5,635
Sorry bout all that M8, it's been a slack day, only one buy, no sells, that means I need several BD's to calm my nerves.... Cya's tomorra....
ps - Lucky there aint no Sheep in this paddock, an angry bull and some sheep don't mix too good....
Dr B got a stray self shedder (sheep, heavy hogget by the looks of it) that walked in a few weeks ago, no body has claimed it is it is very visable from the road Now thinks its a heifer. She who is never wrong is making it into a pet, even though I keep it Lamb Chops !!!!
 
Last edited:

DrBourse

If you don't Ask, you don't Get.
Joined
14 January 2010
Posts
708
Reactions
1,550
Today is Friday 20/10/23 at abt 2.15pm….
Some Weekend Homework for Beginners....
We obviously do not know what will happen on Monday 23/10/23….

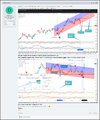
But have a look at GUD….. The current SP @ abt $10.80 is BELOW it’s Current IV $12.41...
This is a situation where we need to prepare for and be ready to enter if all goes to plan….

If Monday Mornings Candle is Green, it will, in effect, be a Bounce off the BCF (pages 197 to 199),..
And the DMI should follow the standard DMI Rules (see instructions on the chart & pages 105–107)….
The CCI Indicator has already formed a Double Bottom (pages 20, 82, 96, 97 & 109)….
The DMI Blue Line has already crossed up through the Red D- Line…. (pages 105, 106 & 107)…
So the DMI should produce the Blue Line continuing up, the Red Line Turn Down, and the Green Line turn UP….

Then we would need to watch what happens to the Blue & Green Lines – On the previous trade 13/6/23 to 18/9/23, note where the Blue & Green Lines were from 12/7/23 to 18/9/23 in relation to the actual SP…. That is, while the Blue & Green lines are above the Red Line, we stay in the Trade, even though there were a few Minor Exit Signals...
20231020 GUD Cht.png
If the above does not go to plan, we revert to Plan B, and look for something else to trade....
Cheers...
DrB...
 
Joined
8 March 2007
Posts
1,618
Reactions
2,047
I Don't Get it
Trend lines IMHO need at least 2 and even 3 is better to draw a line
A trend line drawn from only ONE (1) point can be drawn to any 180 degrees
As they say
If it works for you it works for you

It doesn't work for me
1697781154471.png
 

DrBourse

If you don't Ask, you don't Get.
Joined
14 January 2010
Posts
708
Reactions
1,550
I Don't Get it
Trend lines IMHO need at least 2 and even 3 is better to draw a line
A trend line drawn from only ONE (1) point can be drawn to any 180 degrees
As they say
If it works for you it works for you

It doesn't work for me
View attachment 164331
Hi Captain C….

Yes. you are correct, AND No, you are not correct…. Allow me to explain…..
As you know, everything changes, new innovations appear….
The Rule for Trend lines used to be, to touch 2 or maybe 3 points….
Today, most “TA Types” call for a MINIMUM of 5 Points for each Trend Line…..
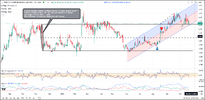
A Support/Resistance Trend Line should also touch at least Five O,H,L or C points (see page 35).

Page 035 Sup Res Lines 2.JPG


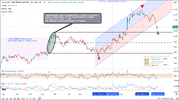
Next, you mention only ONE(1) point, so I assume you are referring to what’s known as a “Benchmark Candle Formation” (BCF) – And yes, it is drawn from 3 points from within a BCF….

You asked the same Question of me back on 16th March 2023 post #188 here in my General Help for Beginners Forum – you obviously missed that post… suggest that you read it ASAP….

I then followed post #188 with post #189 & 191 also in my General Help for Beginners Forum …..

Might I also suggest that you read post #198, that post explains a bit more about the BCF, as well as Commercially Published TA and Un-Published TA, also in my General Help for Beginners Forum ….

There are numerous examples of the BCF in action, such as post #166, #201, #208, #209, #215, also in my General Help for Beginners Forum ….

RIC is one of the better examples of the BCF Theory – this post is from my Forum TA Help for Beginners Post #157 dated 17/2/23:-

20231020 RIC Cht 1.png

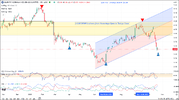
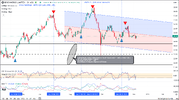
Now here is the current Chart – still under the influence of the 12 month old BCF….

20231020 RIC Cht 2.png

Hope all that helps…

Cheers…
DrB
 

DrBourse

If you don't Ask, you don't Get.
Joined
14 January 2010
Posts
708
Reactions
1,550
Hi Captain C….

Yes. you are correct, AND No, you are not correct…. Allow me to explain…..
As you know, everything changes, new innovations appear….
The Rule for Trend lines used to be, to touch 2 or maybe 3 points….
Today, most “TA Types” call for a MINIMUM of 5 Points for each Trend Line…..
A Support/Resistance Trend Line should also touch at least Five O,H,L or C points (see page 35).

View attachment 164342


Next, you mention only ONE(1) point, so I assume you are referring to what’s known as a “Benchmark Candle Formation” (BCF) – And yes, it is drawn from 3 points from within a BCF….

You asked the same Question of me back on 16th March 2023 post #188 here in my General Help for Beginners Forum – you obviously missed that post… suggest that you read it ASAP….

I then followed post #188 with post #189 & 191 also in my General Help for Beginners Forum …..

Might I also suggest that you read post #198, that post explains a bit more about the BCF, as well as Commercially Published TA and Un-Published TA, also in my General Help for Beginners Forum ….

There are numerous examples of the BCF in action, such as post #166, #201, #208, #209, #215, also in my General Help for Beginners Forum ….

RIC is one of the better examples of the BCF Theory – this post is from my Forum TA Help for Beginners Post #157 dated 17/2/23:-

View attachment 164343

Now here is the current Chart – still under the influence of the 12 month old BCF….

View attachment 164344

Hope all that helps…

Cheers…
DrB
Hi Again Captain C....
Thought I would re-post a few old paragraphs here as they refer to the above BCF discussion.....

"A Bullish ST Breakout from a Benchmark Candle Formation is when there are 2 consecutive Green Candles wholly ABOVE the Top Benchmark Candle Formation Line, that is, OHL&C all ABOVE that Top Line - Then there needs to be confirmation from other Indicators, in my case I use the CCI & the MFI....
AND....
A Bearish ST Breakout from a Benchmark Candle Formation is when there are 2 consecutive Red Candles wholly BELOW the Bottom Benchmark Candle Formation Line, that is, OHL&C all BELOW that Bottom Line - Then there needs to be confirmation from other Indicators, in my case I use the CCI & the MFI....
THEN.....
If the SP re-enters the Benchmark Candle Formation the entire process begins again"....


AND

"Most of the Commercially Published TA, and to a lesser extent FA, is aimed at the Beginners of this Industry.

Most of the Un-Published TA, and to a lesser extent FA, is tightly held within Industry Ranks of Brokers, Merchant Bankers, etc. etc.

The fact that I often post the Un-Published TA is what the Professionals within the ASX World are pizzed off about".

Such as Unpublished TA about Benchmark Candles, Containment Candles (page 30), and a few others..
In other words Brokers and savvy traders know that the Mums and Dads, and the beginners use, namely the old versions, Brokers & savvy traders use the Un-Published Versions....

Everyone should be using their own Research and their own Common Sense when reading my posts
....

Cheers...
DrB.
 

DrBourse

If you don't Ask, you don't Get.
Joined
14 January 2010
Posts
708
Reactions
1,550
For todays useless bit of info, I submit the following for all Beginners to consider..

VALUING GOLD, ETC AND OTHER INDICIES..
Technical Analysis (TA) and the Internet are the only real Research Tools we have for GOLD and other indicies...
There is no such thing as "Fundamental Factors or Fundamental Analysis for Gold, Silver, etc, or most Indicies".
That is, there are no Ratios, Margins of Safety, or Balance Sheet Analysis of any kind available to us that would produce what is known as Fundamental Analysis or Fundamental Factors…
There are, however, outside influences, such as Soverign Country Manipulation, Economic & Market Forces, Wars, Political Interference, Brokers Analysis, Announcements, Press Releases, Ramping, Inuendos, Speculation, Fear & FOMO (Fear of Missing Out), Chat Room Posts, and other misleading information that we can use to help evaluate the likes of Gold/Indicies etc....
(There are bound to be some others I have omitted or can't remember)...

SO, as mentioned above, remember that the only real Research Tool we have is our knowledge of Technical Analysis (TA), and other published information from trusted sources (such as the Internet)…
 
Top