
DrBourse
If you don't Ask, You don't Get.
- Joined
- 14 January 2010
- Posts
- 963
- Reactions
- 2,323


Then you dig a little deeper into TradingView in this case, where we find the following Target Price Analysis - analysis that I believe to be more accurate than most other publications....Another example of Information meant to Confuse Beginners - Hope you can follow the sequence below....
This post might also shine some creedence on my words in post Nr 100(above)....
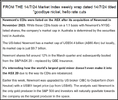
The 1st snapshot below is self explanatory - Note the "USD$61 Outperform Target Price (= abt AUD$90.00)"....
View attachment 180810
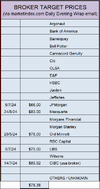
The next Snapshot is a list of Target Prices from a variety of Brokers showing an Average Target Price of $78.38....
View attachment 180812
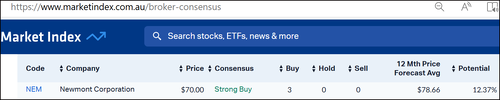
And Finally from the MarketIndex 15/7/24 @ 11.33am....
View attachment 180811
So which TP would you think is ok to use for your Research & Analysis....
14/7/24 USD$61 = abt $90AUD....
As at 15/7/24 $78.38 as an average from MarketIndex Morning & Evening Reports....
OR....
Then on 15/7/24 @ 11.33am MarketIndex suggest that NEM is suddenly OVERBOUGHT @ $70.00.....
And to add insult to injury,this morning 16/7/24 MarketIndex quote NEM in their Brokers Consensus List as shown below....
View attachment 180813
So which is it MarketIndex, Overbought @ $70.00 - OR - STRONG BUY @ A 12 Mth TP OF $78.66....
And all that above data & information came from MarketIndex on 14/7/24 & 15/7/24....
Pretty neat Eh!
One last comment from me, IMO an Intrinsic Value is a pretty precise thing if it is calculated correctly, BUT, on the other hand a Brokers Target Price is a Mythical Guesstimate based on each individual "Brokers In House Rules", as I have documented in numerous past posts in the 3 "DrB Help for Beginners Forums (General, FA & TA)"....
I've had the NEM IV @ $74.65 since early 2024....
Dr.B


Enjoy your retirement @DrBourseASF Members….
Just a short note from me to say that I am getting out of all aspects of Share Trading and the ASX World…
I have finished selling every stock that I held…. Yesterday I finished backing up copies of everything, and I have now removed all traces of anything related to shares & the ASX from my computers and placed all that data on an easily accessible External Drive…
I retired from the workforce at age 45, just because I could… been Share Trading for the past 32 years…. It’s now time to RETIRE….
My thanks to everyone for the interesting ASF ride.….
Good Luck & Goodbye…
Dr.B
15/11/24
quiteSorry folks – I cannot remain quite when it comes to …
I . I.. I.. I..
The fight isn’t amongst people anymore, it’s amongst corporations with the fastest computing power, closest access to the exchanges, the best data scientists, mathematicians and string theorists. And if you think I am making this stuff up, I’m not. Read Michael Lewis’ Flash Boys and Gregory Zuckerman’s The Man Who Solved the Market”… |
Keep well Dr BGood morning,
For today’s useless bit of information, I submit the following.
There are always numerous countries around the world playing political games at any given time.
The 2 major ones in today’s economic climate are Mr Putin, he drops bombs to kill people – then there is Mr Thump, he talks of tariffs to scare people.
Both have their agenda’s, Putin user his brawn, Thump uses his brain.
Thump has always given clues of his intentions, pity most people just did not twig to his ‘end game’.
Australian Politicians screaming for Albo to phone MrT are a joke – Albo phoned weeks ago, he knows we will end up with just our Trade Agreement, and no tariffs.
As a follow-up to Mr Thump’s game, IMO, effective & accurate analysis based on Technical, and/or, Financial information, went ‘out the window’ recently.
Warfare at different levels (economic, domestic & militarily), will be the norm for months to come.
Not even Mr Thump knows what the world economic picture will look like within the near-term future.
TA & FA Analysis by Brokers etc. over the next 30/90 days should be viewed as ‘suspect, and self-serving’ - Guesstimates will rule supreme, they will need to assume way too much data in order to produce results for the sheep.
All forms of TA will take those 30/90 days to unscramble, as some Indicator ‘end points’ will still reflect the recent market gyrations, thus giving incorrect readings.
So, to the posters that have recently asked for my research on certain stocks, I’m sorry, but there will be no more research from me in the near term.
When I can see normality returning to the markets I will then continue to answer your PC posts, posts & emails.
Cheers.
DrB.
@rcw1Sorry folks – I cannot remain quite when it comes to CSL…
I know that nobody in the Main Room believed my previous calls on CSL (Early Feb 2023, and again from June 2023 – Nov 2023), and most punters rubbished my TA - so I’m not sure if I should butt in again, or just sit quietly and watch..
Firstly – Current CSL Financials rate as “AVERAGE”.
Next - CSL Financials have never been rated as Good or Very Good since their inception.
Next – There are so many “Technical & Financial Signals” that suggest “Downtrend”, that it would take me too long to list them all…
Next – CSL Half Yearly Guidance of 10-13% probably indicates a SP of abt $280+/-, and will not result in the $350+ Analyst Guesstimates - CSL don’t really need the endless Analysts ramping of $350+, but then again they must have their reasons for those calls, unfortunately those reasons usually have nothing to do with Financial or Technical Analysis.
Next - CSL Hierarchy issue limited, useless, and unconvincing announcements that are usually of the Foot’n’Mouth variety…
As you probably know, CSL is not a Fav of mine, But CSL is a good stock to trade when/if you know what you’re doing..
For the sake of any Newbies & Lemmings that blindly follow “Analysts Blurb”, I hope I’m wrong this time..
Cheers
@ShareSuccess Be so careful of falling knives. One must grab the handle and not the blade.I Love Falling Knives ha ha & when it comes to great Stocks like CSL i Hope it does Fall lower so i can increase my Margin of safety when buying into the Stock.
more importantly remember to move your foot !! ( much worse than a cut to the hand/fingers )@ShareSuccess Be so careful of falling knives. One must grab the handle and not the blade.
Great postEverybody needs to get up to date with “OLD SAYINGS” – They are just that – “USELESS OLD SAYINGS”……The fear everyone has about May & October each year is RIDICULOUS - most are Great Months – Particularly since the year 2000…..
OCTOBERS for 2000, 2001, 2002, 2003, 2004, 2006, 2007, 2010, 2011, 2012, 2013, 2014, 2015, 2017, 2019, 2020, 2021, 2022, were all UP.....
OCTOBERS for 2005, 2008, 2009, 2016, 2018, 2023 & 2024 were down.....
MAY, 2001, 2002, 2003, 2004, 2005, 2007, 2008, 2009, 2014, 2016, 2018, 2019, 2020, 2021, 2024 were all UP and MAY 2025 is UP as at 19/5/25.....
MAY 2006, 2010, 2011, 2012, 2013, 2015, 2017, 2022, 2023, were down.....
Now I need to clarify something about the May/October Theory, it all depends on which school you went to....
Some say that the calculation is "that a particular month is either Up or Down in relation to the previous month" (not really sure what part of the previous months data they would use - High, Low, 1st day, Last day, etc)...
Most Analysts/Brokers say the calculation is "that a particular month is either Up or Down from Close Of Trading on the 1st day of the month TO Close Of Trading on the last day of the month...
Others suggest the calculation should be from "the opening price on day one to the closing price on the last day of the month...
The May/Oct Theory dates back to the early to mid 1900's when Company Reporting Rules revolved around the now obsolete March & September Reporting Timetables.....
They are old "Share Trading Rules" that belong to a past era, and as such have outlived their usefulness - Smart Brokers are using scare tactics and misguided fear to make profits at your expense..
WAKE UP AUZZIE.....Savvy Brokers are all about setting you up AGAIN......
When you think about it, it really is a form of Ramping......
All I can suggest is that you must DYOR if you are relying on this OUTDATED THEORY....
We use cookies and similar technologies for the following purposes:
Do you accept cookies and these technologies?
We use cookies and similar technologies for the following purposes:
Do you accept cookies and these technologies?