
tech/a
No Ordinary Duck
- Joined
- 14 October 2004
- Posts
- 20,508
- Reactions
- 6,739
Thanks Eunza.
What I do note and wish to point out in all charts thrown up (including ALL) is there are many cases shown on the charts where there is divergence which has both succeeded and failed.
The addition of filters is an attempt to increase the reliability of an indicator which is often giving signals which equate to very little.
I note that Sinner sees a pullback within an up move as a successful divergence trade.(There are also some un successful ones on the charts presented.)
Pitty we dont have more than Eunzas charts to consider.


Hi Professor,
You have labeled the divergence on the price extremes. Are you using the close price or price extreme as the points of price for the divergence?
I will show how both of these codes give false results in systems testing---but before I do I wonder if others use anything else?
When testing only the last swing will be taken.
I hope the charts shown make it clear to those who actually test.
If you do youll know exactly what I mean.
If you dont then be aware of the fact that many signals and trades which come along in R/T trading wont be found by code (algorithms) in systems tests.
Same thing happens when using Peak and trough Code to identify peaks and troughs but even worse.
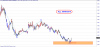
Ive used with Profs permission his chart XAO and his code for the example.
Morning.
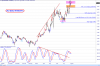
Perhaps this will make it clearer.
If you search for a LLV,20 of anything today and something is at its LLV for the past 20 days it will be found.
If you run that same test tomorrow and the price has made a lower low then it will show it again on that lower low.
If you run the test the next day and price trades at another lower low then THAT low will be shown.
The initial low which was TRUE 2 days ago is now False.
SO WITH a SYSTEMS test the ONLY way the Algorithm of a LLV can be confirmed is (If using a 20 period condition) to wait until the NEXT 20 bars pass before printing the trade.
UNLESS you have a LATCH locking the FIRST occurrence of the condition you will be getting false results.
Anyway if this doesn't help ----- you may wish to re visit this post when you realize your R/T trading isn't emulating your systems testing (Meaning anyone who trades off self designed systems.)----
I just walked it through using bar replay and it spat out in real time exactly as it shows on the chart I highlighted.
oh dear we are starting go around in circles. I mustn't have made myself clear so I'll highlight the important part of the post I previously made:
The code I posted up doesn't look forward.
Thanks Professor.Hi Snake,
I've used the extremes(lows) for the divergence. The white lines that were on the chart I posted were simply drawn on, the green arrows are what the software spat out at me after plotting the code I put together.
Cheers

We use cookies and similar technologies for the following purposes:
Do you accept cookies and these technologies?
We use cookies and similar technologies for the following purposes:
Do you accept cookies and these technologies?